On the project dashboard page, below the main project information at the top of the page, there are three main tabs: Roster, Reports and Admin. In this article we will review the Reports tab.
Click on the Reports tab to view each of the Report options that are available.
Project Reports
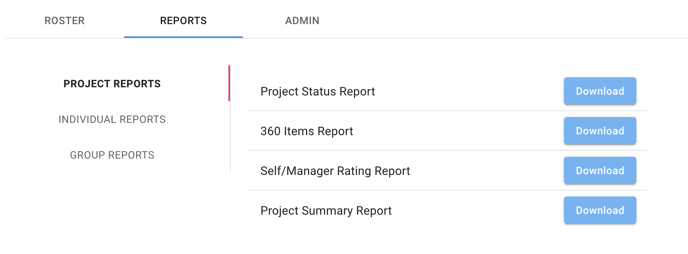
There are four different reports available under the Project Reports category.
Project Status Report. This is a report showing each of the raters that are in the project and their survey completion status. Click the download button to create and download an Excel file.
360 Items Report. This is a report listing all of the competency categories, subcategories and items within this project survey. It also includes any open-ended questions that were included. Click the download button to create and download an Excel file.
Self/Manager Rating Report. This is a report listing all of the competency categories, subcategories and items within this project survey. It also includes any open-ended questions that were included. Click the download button to create and download an Excel file.
Project Summary Report. This is a report listing all of the competency categories, subcategories and items within this project survey. It also includes any open-ended questions that were included. Click the download button to create and download an Excel file.
Individual Reports
The 360 individual reports include:
- Competency category averages
- Competency subcategory averages with rater group scores
- Leadership Quadrant scores segmented in the following categories:
- Known Strengths
- Hidden Strengths
- Known Areas For Development
- Blind Spots
- Item scores - Includes rater groups, average excluding self and self scores
- Open-ended question responses
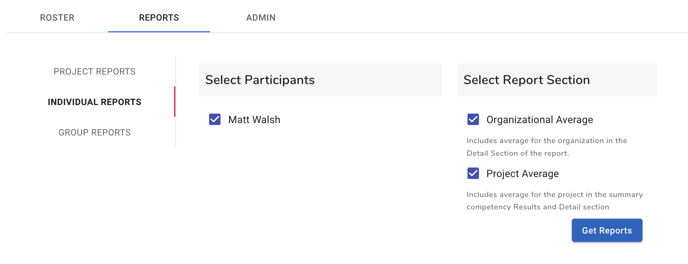
To create an individual report, select the name of the Participant by clicking the checkbox next to their name in the list of Participants.
Then select the desired customization options on the right side of the tab.
Organizational Average includes averages for the organization in the Items Detail section of the report. This average continues to change as you add more project data to the system and will be an organization norm to compare against.
Project Average includes averages for the project in the Summary and Items Detail sections of the report. This is an average of all of the Participants that are included in the project.
After you have selected the desired settings and Participant(s), click the Get Reports button.
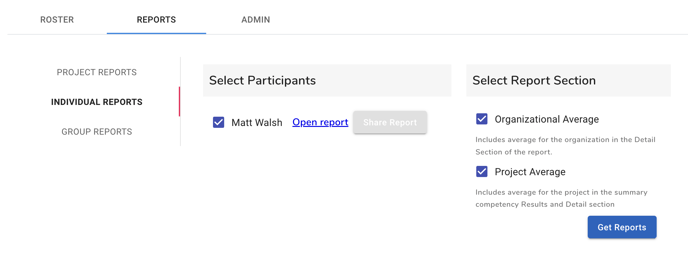
You will see two options appear next to the Participant(s) name.
The Open report link opens the digital report in a new browser tab.
The Share Report button sends an email with a report link to the Participant allowing them to view the digital report.
Note: It is recommended that the project administrator or leadership coach view the report before sharing the results with the participant.
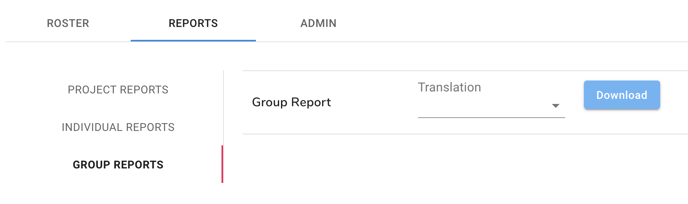
Group Reports
The Group report option provides a group average for each competency category and subcategory
Project Status Report. This is a report showing each of the raters that are in the project and their survey completion status. Click the download button to create and download an Excel file.
Continue to: 360 Admin: Project Dashboard - Admin Tab